Analysing the UnifiedPush Server
July 25, 2017
Attempting to get familiarized with the UPS codebase and its under-the-hood intricacies is a pretty daunting task. A good step in the right direction, for me at least, was attempting to analyse the metrics and the overall quality of the codebase. Having a higher level overview of what is currently there and a vague idea of what can be improved upon is generally a good place to start.
So with that objective in mind we were recommended two tools in particular to play around with, Structure101 and SonarQube. I’ll focus on the latter for now, taking a look at using it to perform a simple metrics based code analysis on the Unified Push Server.
SonarQube
SonarQube is definitely the least complicated of the two in terms of getting going quickly and is intuitive enough that you can start diving in straight away with small changes.
If you’re having trouble installing it, here’s a great guide to getting started.
In a very short amount of time, with the project configured correctly, you’re presented with a nice looking dashboard that gives you an overview of your project’s bugs, vulnerabilities, technical debt, test coverage and more:
SonarQube has a variety of cool features to explore: the issues tab lists all of the main issues within the codebase (bugs, code smells and vulnerabilities), their level of importance, and even the estimated amount of time it would take to fix the issue. Clicking on each issue gives you an explanation of it and includes a nice example. Clicking on the class link shows you where each issue appears in that class and which lines are not covered by tests. The rules tab provides a huge list of rules & best practices for a handful of different languages.
It goes without saying that the benefits of having a tool that not only tells you that you’re doing something wrong, but gives you an understanding of why something you’ve written is not considered best practice and what you can do to improve it, are unquantifiable.
Taking a look at the UPS
To analyse the UPS I configured the project properties (see here) and simply ran sonar-scanner.
I did bump my head a bit with JaCoCo and generating the code coverage report, which was overcome by firstly updating the version to the latest, and secondly enabling the code-coverage maven profile (the UPS already had JaCoCo installed, but not enabled by default):
mvn -Ptest,code-coverage clean install.
With the report being generated I could update the sonar-project.properties file to point to the jacoco executable, allowing us to see the total code coverage on the Sonar dashboard.
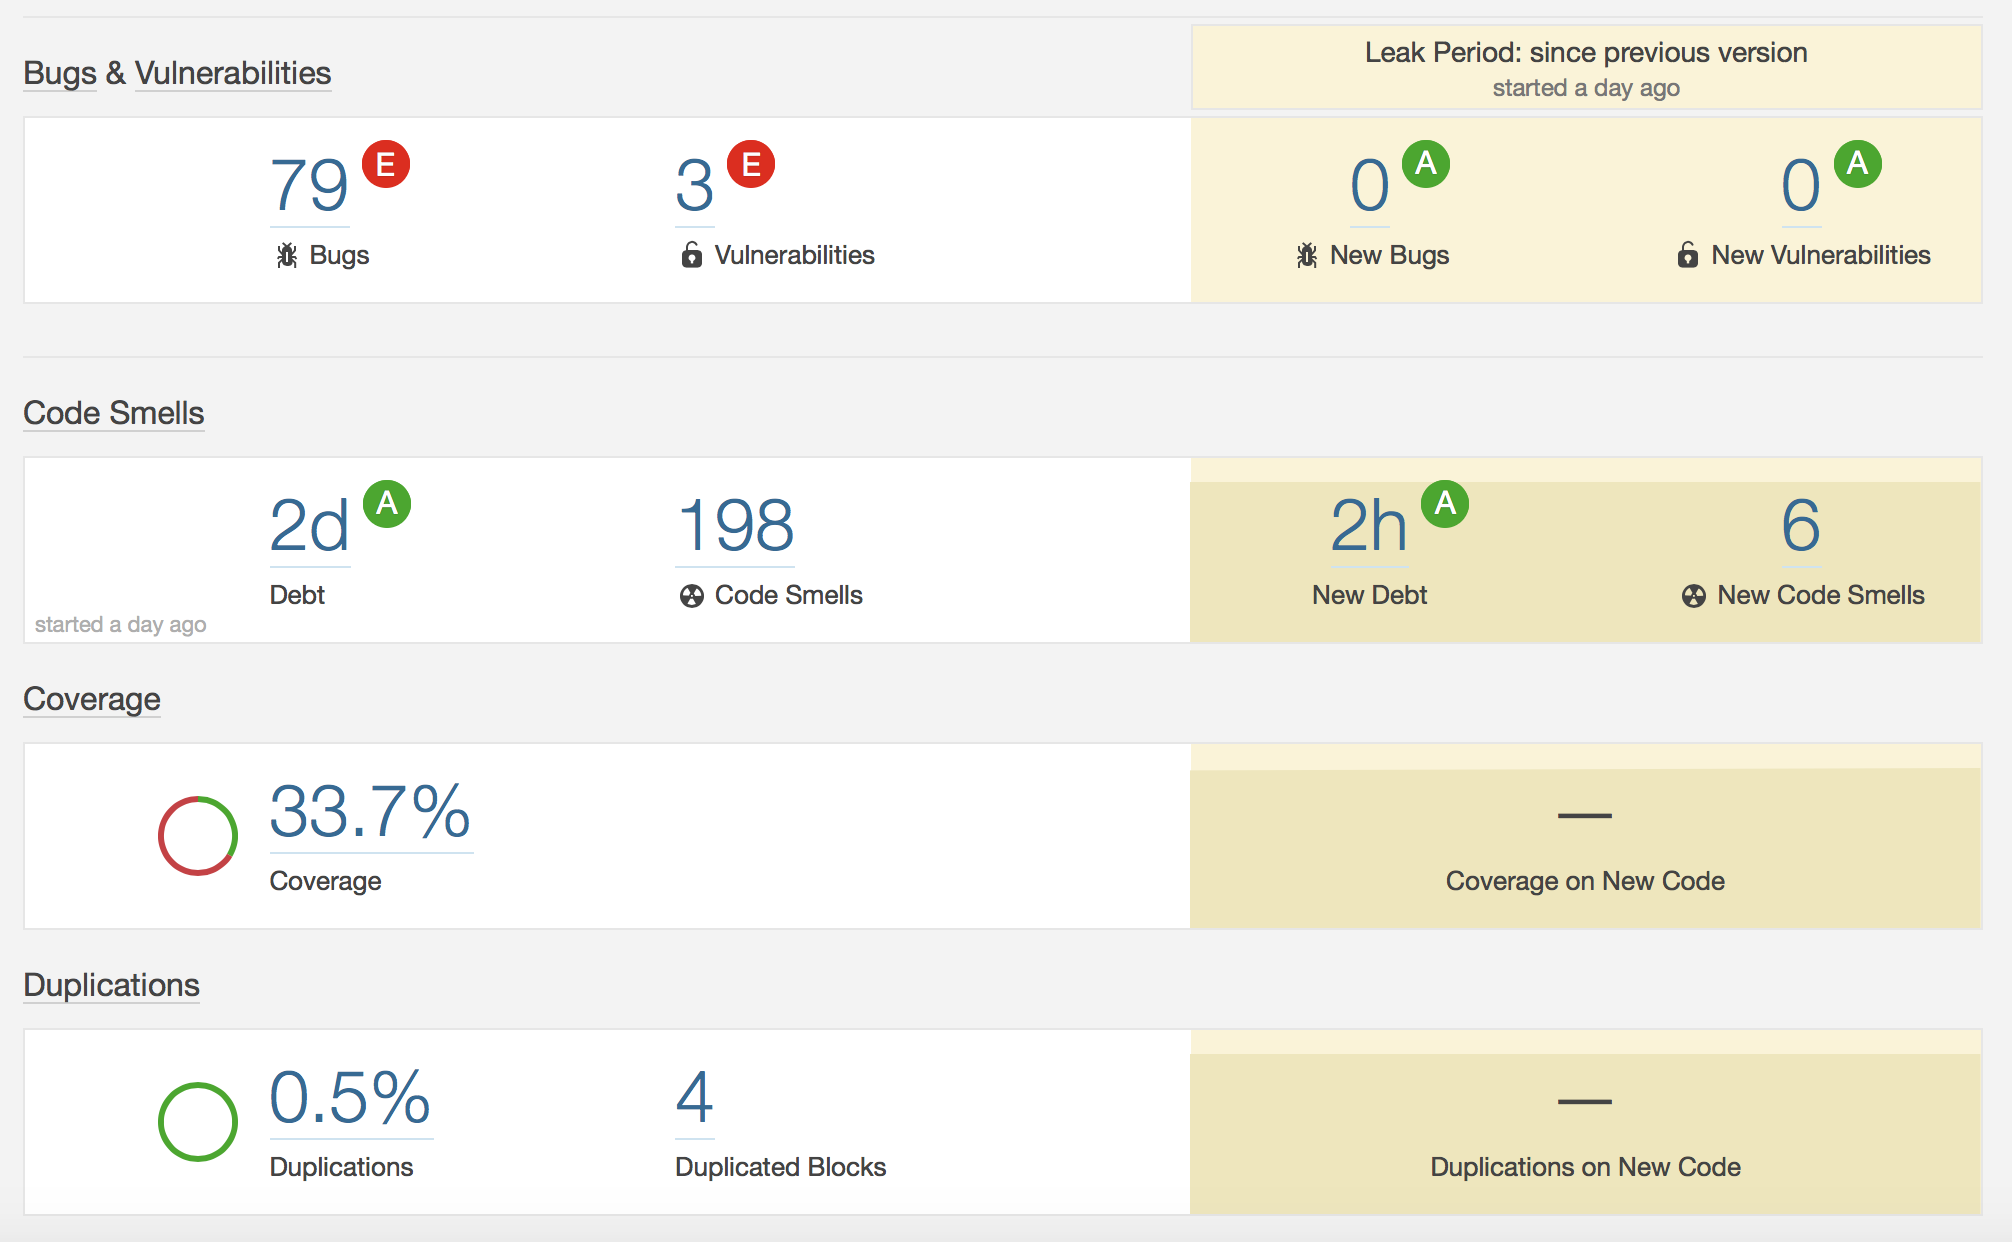
Overall, the UPS holds up quite well:
There are 198 code smells, or minor issues, which average to 2 days of technical debt. That’s less than a 5% technical debt ratio which I think is pretty impressive! A lot of these have to do with code style & best practices (for example, renaming constants to match the regular expression
^[A-Z][A-Z0-9]*(_[A-Z0-9]+)*$, or not nesting more than 3ifstatements).There are 79 bugs, some major, some minor, and a few blockers. A significant amount of these are related to rethrowing/logging unlogged exceptions, or statements that haven’t been properly closed.
There are 3 vulnerabilities, 2 of which related again to logging exceptions, this time which have been printed to the default
System.Errstream with theThrowable.printStackTracemethod. SonarQube points out that this could inadvertently expose sensitive information, which is why it is considered a vulnerability - something I had no idea about before now. The last vulnerability is related to password security in theHttpBasicHelperclass in therestmodule.Code coverage is only at 33.7%, which leaves room for improvement, and is something myself & Polina now know we should be aware of with whatever we implement in the future.
With a static code analysis in place and a good idea of the overall code quality, we can now look at the structure and architecture of the code base, using Structure101.
Structure101
I’ll admit that Structure101 can be quite confusing to get to grips with. Jumping right in and investigating the different options and what they do is probably the best way to get started.
There’s a multitude of different features to explore in Structure101. A good one to take a look at is the summary tab. It breaks the project down and analyses the size, architecture and model of the project, the structural complexity, the tangles and fat percentage (which I’ll get to later) at package, class and method levels, and where exactly these issues are occurring.
Getting started
Once you’ve installed Structure101, select your project type (I chose maven obviously) and experiment with selecting different options on the startup screen.
You’ll be presented with a graph in the top left corner which represents structural complexity of the project. The y-axis measures the tangled percentage (i.e. cyclic dependencies), while the x-axis measures the fat percentage (i.e. the overall number of dependencies). The lower the tangle measure and the lower the fat percentage the more structured a project is likely to be.
Underneath the graph you’ll get a list of the main culprits causing tangles/fat in your project. Double clicking on one of these will take you to the exact location in your project structure which is displaying the problem.
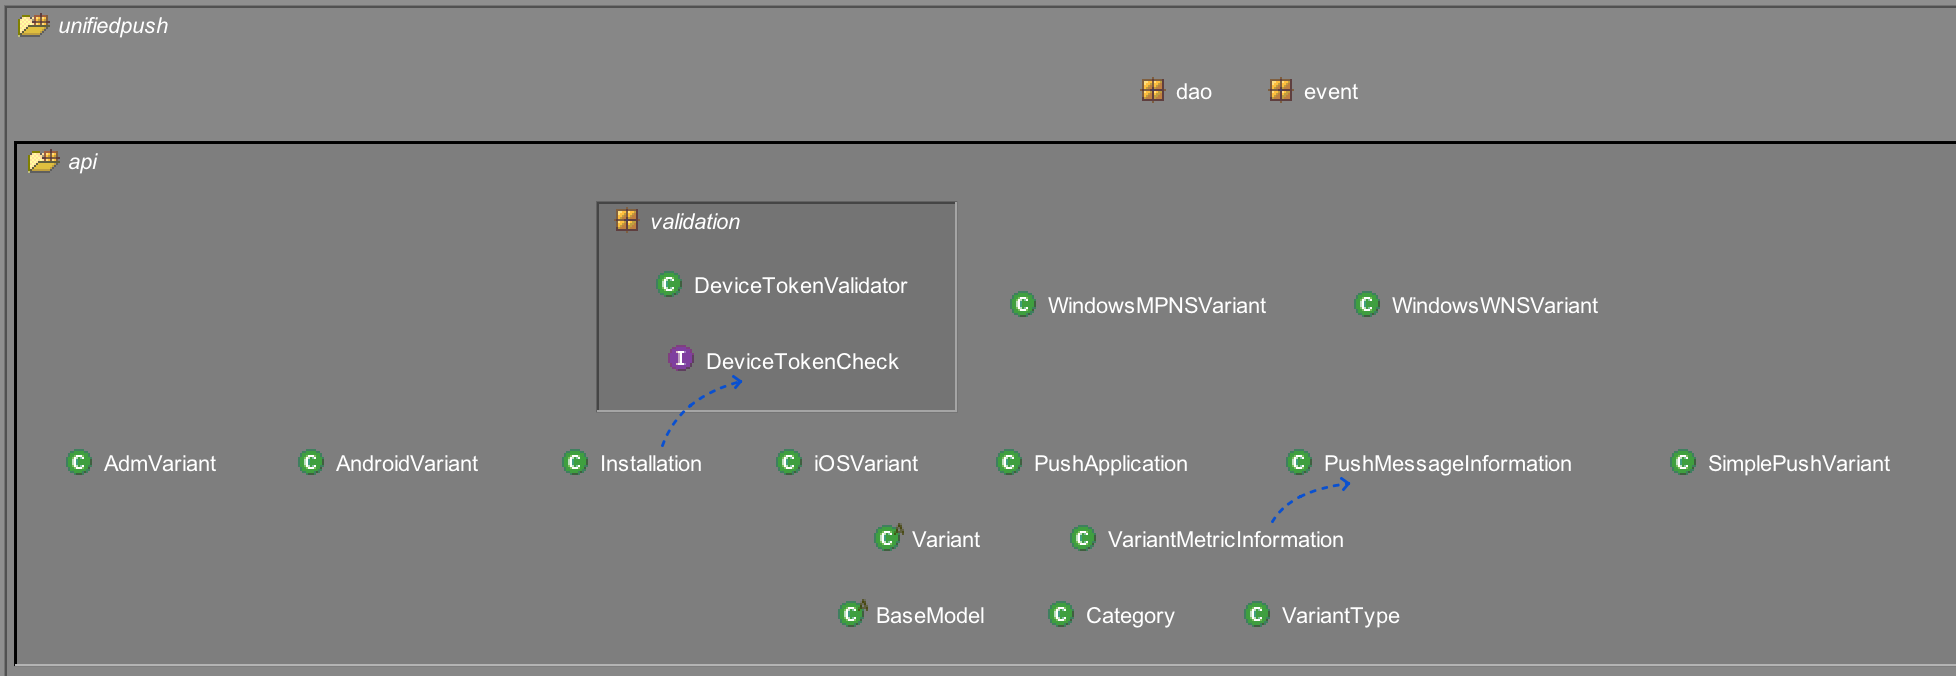
As an example, I’ll look at a tangle in the UPS, under the model/api module, in the api package: double clicking on the tangle in the left panel takes me to the exact package, where I can see there are actually two tangles (but I’ll focus on the second):
Double clicking on the blue arrow gives me more details about the tangle. In this case, there’s a cyclic dependency between the VariantMetricInformation class and the the PushMessageInformation class. Both classes are referencing each other:
Taking a look at the UPS
Once again it’s cool to see how well the UPS performs on a structural level:
Excessive Structural Complexity (XS) is 1%
There are only 4 tangles at the design level (i.e. high-level packages)
No items exceed the fat threshold at the design, leaf-package or class level
Only 1 item exceeds the fat threshold at the method level
Conclusion
While Structure101 and SonarQube are great tools for project analysis, they’re not a silver bullet. I think their most important function is giving the user a good starting point to strategically and logically analyse their codebase, getting insight into the underlying flaws that may or may not exist at a structural or syntactical level. Accepting suggestions blindly probably won’t lead to lasting solutions.
Good first bug
There’s an Aerogear jira label called good_first_bug for anyone who’s looking at getting started with Open Source contribution. Next to that, SonarQube is probably one of the best places to start in terms of small contributions that could make a huge improvement to the quality of the codebase.
Other than that I can highly recommend getting a few of your old projects set up with SonarQube and Structure101, going through the bugs and vulnerabilities, seeing what mistakes you’ve potentially made and then improving on them! It’s a great way to solidify your knowledge and enhance the quality of your projects.


